Solana (SOL) continues to gain stronger-than-expected market interest as its price surpassed $190 earlier today. Representing a solid 6% increase in the last 24 hours, the outlook for the token remains promising.
Following the development, analysts have been predicting ambitious prices for SOL. However, according to this on-chain analysis, those forecasts may not be outrageous in the end.
Solana Reaches Unprecedented Level of On-Chain Activity
At press time, SOL trades at $192.70. The last time the token traded at this level was back in April. However, this price increase does not surprise BeInCrypto.
Last week, we reported that Solana could surpass this year’s open interest high. As of this writing, that has happened. However, that is not the major focus of today’s analysis.
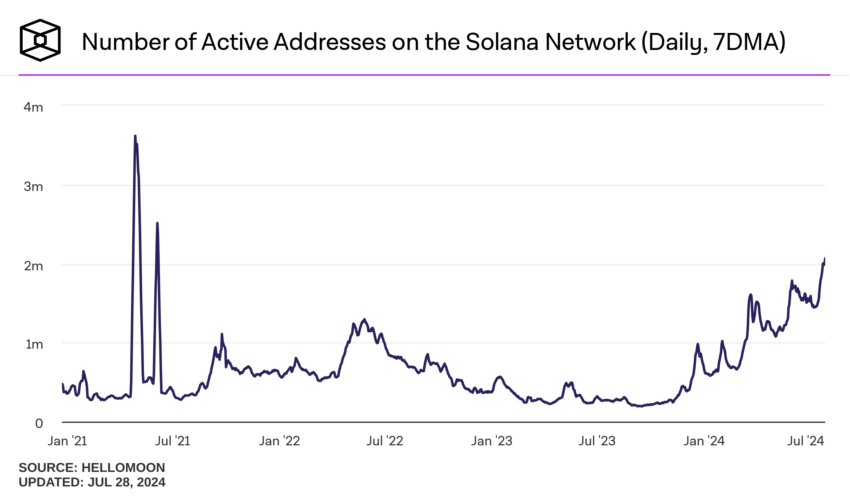
Instead, a key metric on the Solana ecosystem is close to breaking its highest level in three years. The metric in question is the active addresses, which measure the user participation rate on a network.
At press time, Solana’s daily active addresses were 2.07 million, which is only meters away from the 2.26 million it reached during the 2021 bull market.
Read more: 13 Best Solana (SOL) Wallets To Consider in July 2024

It is worth noting that active addresses play a big part in influencing SOL’s price. For instance, during the peak of the 2021 bull cycle, when Solana rose above $260, the network had about 3.14 million active addresses.
Therefore, if the pattern rhymes, the SOL price could be poised to surpass its yearly high and possibly revisit its all-time high.
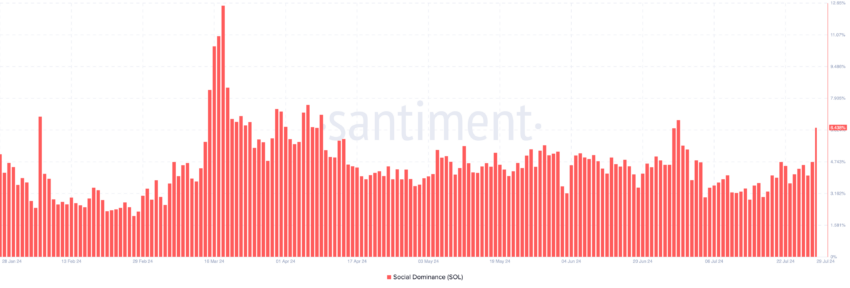
Furthermore, the signs are already there, as Solana’s market cap has outpaced Binance Coin (BNB). The project is also enjoying a good level of social dominance.
At press time, Solana’s social dominance is 6.43%. This hike means that the project is getting more media coverage than most cryptos in the top 100 per market.

If this continues, SOL’s price could continue to climb, surpassing $200 within a short period as it did in March.
SOL Price Prediction: The Journey to a New All-Time High Begins
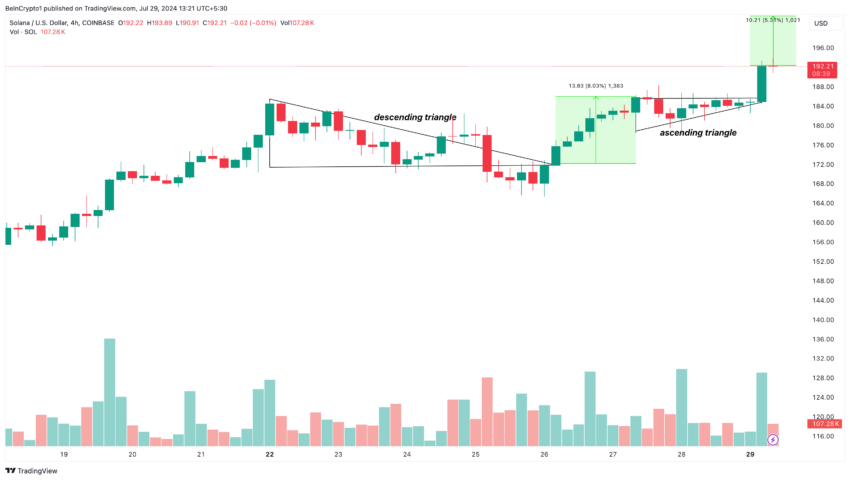
According to the 4-hour chart, Solana’s recent upswing could be linked to the breakout of the descending triangle on July 26. A descending triangle is a bearish pattern that shows the continuation of a downtrend.
However, when the price breaks out of this technical pattern, a notable uptick appears, which is what led SOL to reach $186 earlier. After a slight drawdown, an ascending triangle appeared to validate the bullish bias.
Read more: Solana (SOL) Price Prediction 2024/2025/2030

As shown above, an ascending triangle is a pattern created by a horizontal trendline along the swing highs and a rising trendline along the swing lows. This pattern is bullish and could indicate the continuation of SOL’s uptrend.
On X, investor confidence in SOL’s bullish price prediction has risen. For many analysts, a run to $1,000 could be a prediction too low as they believe that the token could surpass such levels.
“SOL to $1,000 could be conservative.” Chris Burniske, a former crypto lead at ARKInvest, wrote
In addition, SOL could retest $200 in a few days. If validated, the token’s price could start a rally that brings it closer to $260.06, the highest price it reached in November 2021.
However, this prediction may be invalidated if activity on the blockchain falls to a very low point. Sentiment around the token could also turn bearish. If this is the case, the value of SOL may decline toward the $180 level.
Trusted
Disclaimer
In line with the Trust Project guidelines, this price analysis article is for informational purposes only and should not be considered financial or investment advice. BeInCrypto is committed to accurate, unbiased reporting, but market conditions are subject to change without notice. Always conduct your own research and consult with a professional before making any financial decisions. Please note that our Terms and Conditions, Privacy Policy, and Disclaimers have been updated.


