Bonk (BONK) price experienced one of its most significant drawdowns on Monday, August 5. The incident, which led to a sharp decline to $0.000015, caused a notable decrease in leveraged positions.
However, futures traders have moved on quickly from the infamous day, according to recent data. This analysis explains the reason for this change and what to expect from BONK.
Bonk Leveraged Traders Pivot to Bullish Positions
One indicator that gives a clear picture of traders’ position is the Funding Rate. This indicator is the cost of holding an open perpetual position in the market and also acts as a barometer of investors’ expectations.
When the Funding Rate is positive, longs (buyers) pay shorts (sellers) a fee, and the average expectation is bullish. In contrast, negative funding means shorts pay longs while expecting a price decrease.
From the image below, traders aligned with short positions during the earlier downturn. But at press time, BONK’s price has increased beyond previous levels. As a result, Funding has turned positive, indicating that traders in the futures market are hoping to profit from the continued price increase.
Read more: 11 Top Solana Meme Coins to Watch in August 2024

To be crystal clear, if the BONK price continues to increase as funding stays positive, traders will get more rewards for their positions. However, that will only be the case if buying pressure in the spot market remains at a heightened level.
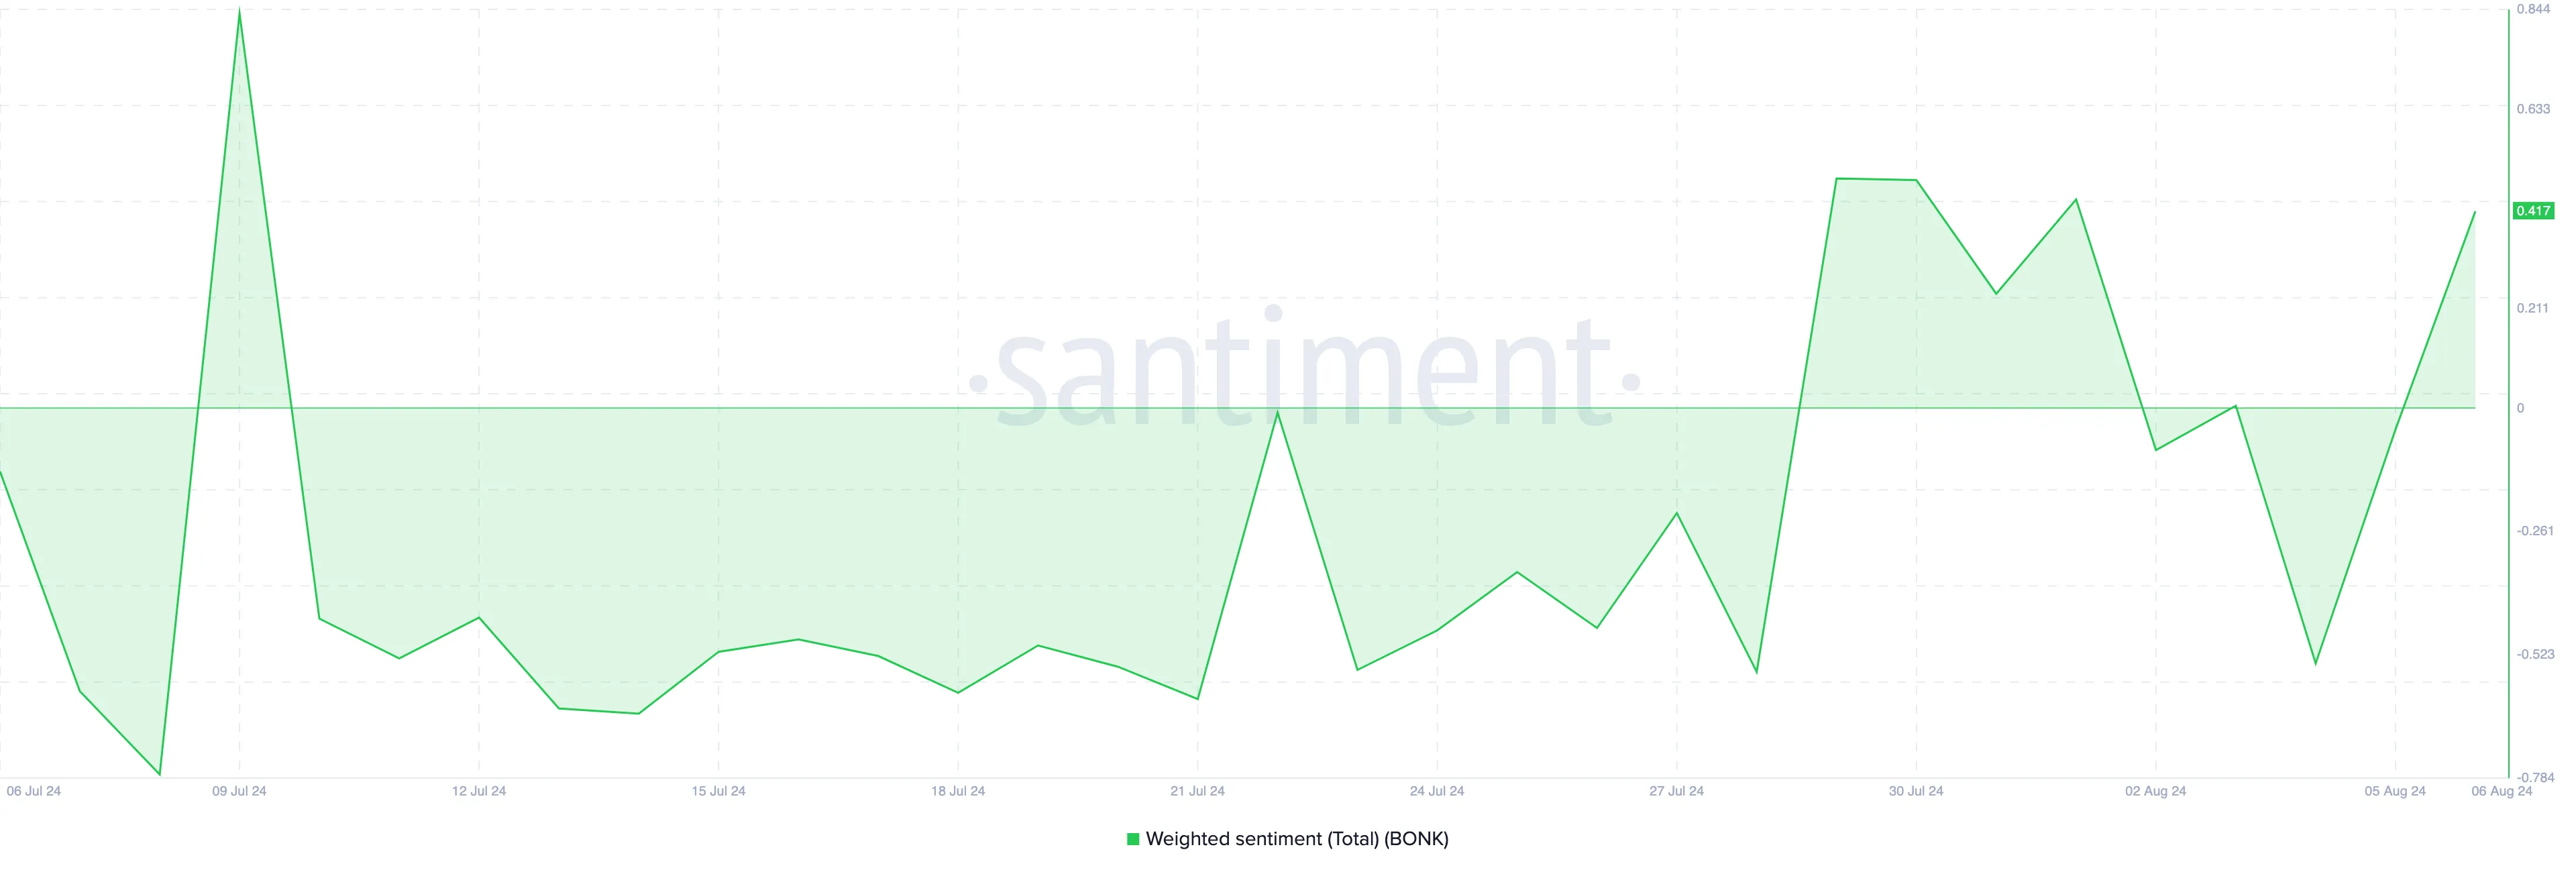
However, futures traders are not the only ones with a changed view of the meme coin. According to Santiment, the Weighted Sentiment around Bonk has left the negative region and is now positive.
Weighted Sentiment uses social volume to measure the perception of a crypto project in the market. If the reading is negative, it means that comments online are mostly gloomy. However, a positive rating like it with BONK indicates a rise in optimistic discussions.

BONK Price Prediction: Bullish Pattern Continues
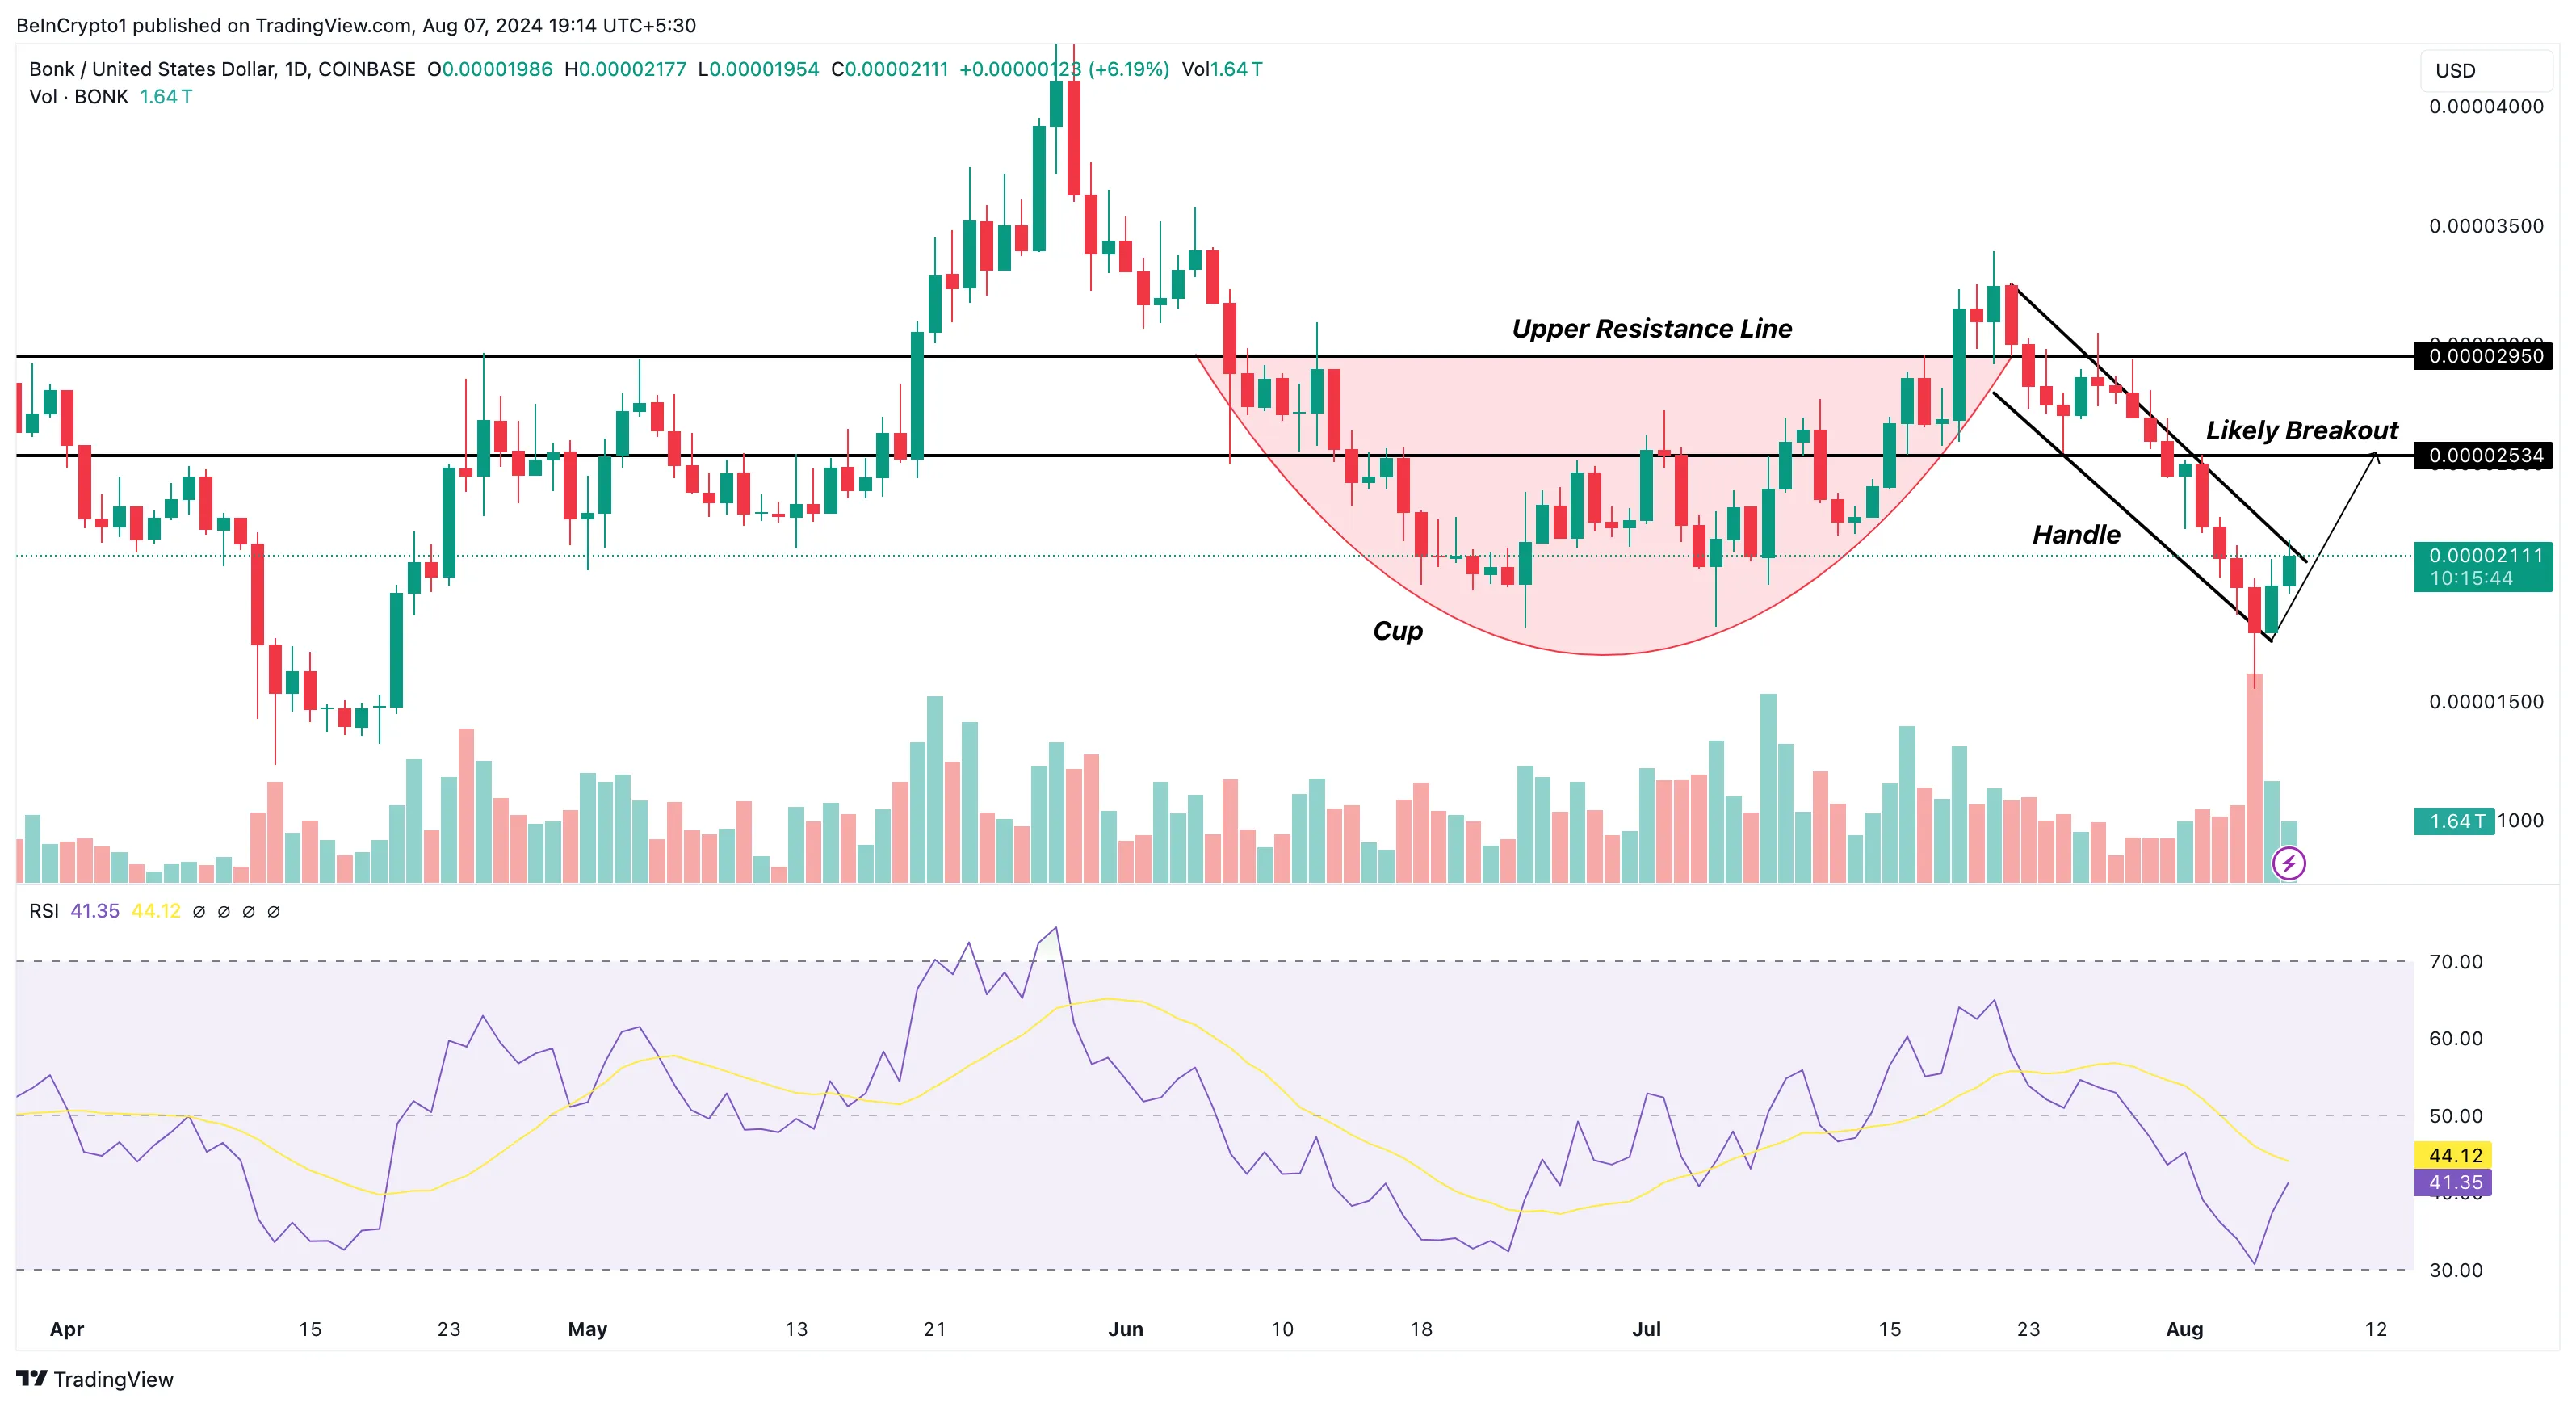
While BONK trades at $0.000021, the daily chart shows that it has formed a cup and handle pattern. This formation is a bullish continuation pattern and appears when a cryptocurrency has undergone a downtrend, recovery, and another downturn amid consolidation.
However, confirmation of the bullish continuation occurs when the price breaks out of the downtrend, as seen in the BONK chart below. If buying pressure increases, the price of BONK may climb to $0.000025 in the coming days.
A successful breach of this level could send the meme coin toward the upper resistance situated at $0.000029. However, traders may need to watch as the Relative Strength Index (RSI), which measures momentum, is yet to cross the neutral line.
Read more: Best Upcoming Airdrops in 2024

Once the RSI does, the bullish thesis may be confirmed, and the value of BONK can increase exponentially. However, failure to surpass the 50.00 midpoint could leave the token hanging between $0.000019 and $0.000021.
Trusted
Disclaimer
In line with the Trust Project guidelines, this price analysis article is for informational purposes only and should not be considered financial or investment advice. BeInCrypto is committed to accurate, unbiased reporting, but market conditions are subject to change without notice. Always conduct your own research and consult with a professional before making any financial decisions. Please note that our Terms and Conditions, Privacy Policy, and Disclaimers have been updated.


